RegionGrid: Applying GeoRegions to Gridded Data
In this section, we go through the basic steps of creating a RegionGrid for RectRegions and PolyRegions. See if you can spot the differences between the RegionGrids generated by the two different types.
Setup
using GeoRegions
using DelimitedFiles
using CairoMakie

download("https://raw.githubusercontent.com/natgeo-wong/GeoPlottingData/main/coastline_resl.txt","coast.cst")
coast = readdlm("coast.cst",comments=true)
clon  = coast[:,1]
clat  = coast[:,2]
nothing
RectGrid Example
geo  = GeoRegion("GF_SSA")
lon  = -180:5:180
lat  = -90:5:90
ggrd = RegionGrid(geo,lon[1:(end-1)],lat)
The Rectilinear Grid has the following properties:
Grid Bounds (grid) : [15, 7, 29, 21]
Longitude Indices (ilon) : [21, 22, 23, 24, 25, 26, 27, 28, 29]
Latitude Indices (ilat) : [7, 8, 9, 10, 11, 12, 13, 14, 15]
Longitude Points (lon) : [280, 285, 290, 295, 300, 305, 310, 315, 320]
Latitude Points (lat) : [-60, -55, -50, -45, -40, -35, -30, -25, -20]
Region Size (nlon * nlat) : 9 lon points x 9 lat pointsPolyGrid Example
geo  = GeoRegion("AR6_NWS")
lon  = -180:2:180;
lat  = -90:2:90;
ggrd = RegionGrid(geo,lon[1:(end-1)],lat)
The Polygonal Grid has the following properties:
Grid Bounds (grid) : [52, 39, 55, 50]
Longitude Indices (ilon) : [50, 51, 52, 53, 54, 55]
Latitude Indices (ilat) : [39, 40, 41, 42, 43, 44, 45, 46, 47, 48, 49, 50, 51, 52]
Longitude Points (lon) : [-82.0, -80.0, -78.0, -76.0, -74.0, -72.0]
Latitude Points (lat) : [-14.0, -12.0, -10.0, -8.0, -6.0, -4.0, -2.0, 0.0, 2.0, 4.0, 6.0, 8.0, 10.0, 12.0]
Region Size (nlon * nlat) : 6 lon points x 14 lat points
Region Mask (sum(mask) / (nlon * nlat)) : 70 / 84So here, we see that in this PolyGrid example, the RegionGrid contains an additional field mask that, within the rectilinear longitude-latitude shape bounding the GeoRegion (because gridded data here is assumed to be rectilinear), the data is within the GeoRegion. Values of 1 indicate it is within the GeoRegion, otherwise the values are `NaN.
ggrd.mask6×14 Matrix{Float64}:
NaN NaN 1.0 1.0 1.0 1.0 1.0 … NaN NaN NaN NaN NaN
NaN 1.0 1.0 1.0 1.0 1.0 1.0 1.0 1.0 NaN NaN NaN
1.0 1.0 1.0 1.0 1.0 1.0 1.0 1.0 1.0 1.0 NaN NaN
1.0 1.0 1.0 1.0 1.0 1.0 1.0 1.0 1.0 1.0 1.0 NaN
1.0 1.0 1.0 1.0 1.0 1.0 1.0 1.0 1.0 1.0 1.0 1.0
1.0 1.0 1.0 1.0 1.0 1.0 1.0 … 1.0 1.0 1.0 1.0 1.0The Mask of a PolyGrid
The PolyGrid type derived from a PolyRegion allows us to apply a mask to filter out data that is within the shape of a PolyRegion on a rectilinear lon-lat grid defined by the bound of a PolyRegion. We consider the following example of an AR6 region over South Asia:
geo  = GeoRegion("AR6_SAS")
lon  = -180:5:180;
lat  = -90:2:90;
ggrd = RegionGrid(geo,lon[1:(end-1)],lat)
The Polygonal Grid has the following properties:
Grid Bounds (grid) : [61, 50, 57, 49]
Longitude Indices (ilon) : [49, 50, 51, 52, 53, 54, 55, 56, 57]
Latitude Indices (ilat) : [50, 51, 52, 53, 54, 55, 56, 57, 58, 59, 60, 61]
Longitude Points (lon) : [60.0, 65.0, 70.0, 75.0, 80.0, 85.0, 90.0, 95.0, 100.0]
Latitude Points (lat) : [8.0, 10.0, 12.0, 14.0, 16.0, 18.0, 20.0, 22.0, 24.0, 26.0, 28.0, 30.0]
Region Size (nlon * nlat) : 9 lon points x 12 lat points
Region Mask (sum(mask) / (nlon * nlat)) : 55 / 108And using the field mask, we plot the points that are in the region (blue), and out of the region (red).
mask = ggrd.mask
grid = ones(size(mask))
inlon = grid .* ggrd.lon;  inlon = inlon[.!isnan.(mask)]
inlat = grid .* ggrd.lat'; inlat = inlat[.!isnan.(mask)]
otlon = grid .* ggrd.lon;  otlon = otlon[isnan.(mask)]
otlat = grid .* ggrd.lat'; otlat = otlat[isnan.(mask)]
blon,blat,slon,slat = coordGeoRegion(geo)

fig = Figure()
aspect = (maximum(slon)-minimum(slon))/(maximum(slat)-minimum(slat))
ax = Axis(
    fig[1,1],width=750,height=750/aspect,
    limits=(minimum(slon)-2,maximum(slon)+2,minimum(slat)-2,maximum(slat)+2)
)

lines!(ax,clon,clat,color=:black)
lines!(ax,blon,blat)
lines!(ax,slon,slat)
scatter!(ax,otlon,otlat)
scatter!(ax,inlon,inlat)

resize_to_layout!(fig)
fig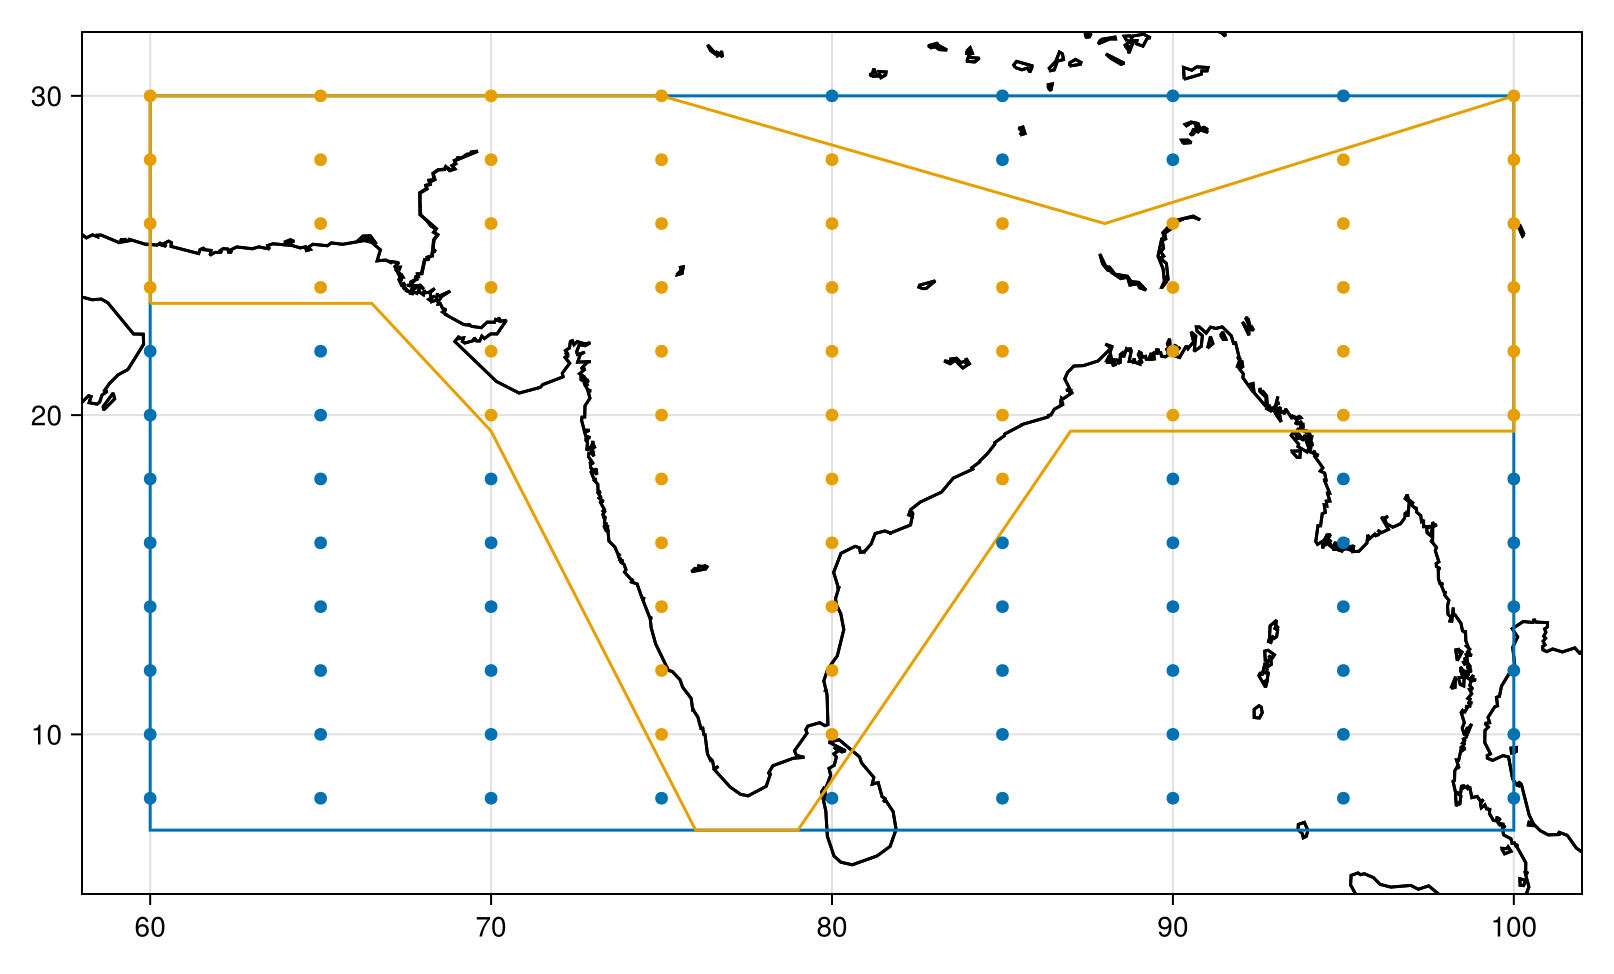
API
RegionGrid(
    geo :: GeoRegion,
    lon :: Union{Vector{<:Real},AbstractRange{<:Real},
    lat :: Union{Vector{<:Real},AbstractRange{<:Real}
) -> RectGrid, PolyGrid
Creates a RectGrid or PolyGrid type based on the following arguments. This method is suitable for rectilinear grids of longitude/latitude output such as from Isca, or from satellite and reanalysis gridded datasets.
Arguments
geo: A GeoRegion of interestlon: A vector orAbstractRangecontaining the longitude pointslat: A vector orAbstractRangecontaining the latitude points
RegionGrid(
    geo :: GeoRegion,
    lon :: Array{<:Real,2},
    lat :: Array{<:Real,2}
) -> RegionGrid
Creates a RegionMask type based on the following arguments. This method is more suitable for non-rectilinear grids of longitude and latitude points, such as in the output of WRF or CESM.
Arguments
geo: A GeoRegion of interestlon: An array containing the longitude pointslat: An array containing the latitude points
This page was generated using Literate.jl.